
VVA By the Numbers
Throughout our history—from what began as the Virginia Satellite Education Network to what is today Virtual Virginia—our program has partnered with public school divisions to provide educational opportunities to students regardless of their location and without requiring applications for admission.
See below for recent data about the VVA program, including enrollment, instruction, and more.
Reporting dates vary by section. Figures are presented as reported; partial-year figures and outstanding verification items are labeled.

Data
Click or tap each category below to view recent VVA-related data.
K–12 Instruction
Enrollment
Virtual Virginia’s K–12 Instruction Program expands course access for students across the Commonwealth, complementing local school offerings through Virginia-licensed teachers and flexible online learning. Students may participate full-time or part-time, including in core academic, elective, Advanced Placement, and dual enrollment courses.
The following figures summarize active student enrollment, full-time and part-time participation, and enrollment by grade group. They reflect different reporting periods and should be read alongside their dates and table headings. The 2026–2027 figures are as of September 29, 2026; earlier academic years are historical comparisons.
Full-time vs. part-time students
Column height represents total students; segments show the full-time and part-time breakdown. Full counts and percentages are in the expandable table below.
Enrollments by grade group and term
Column height represents total term enrollments, not unique students. Full counts and percentages are in the expandable table below.
The table provides the exact annual student totals and full-time and part-time counts and percentages shown in the chart. The current year is a dated snapshot; completed years provide historical context.
View full-time and part-time student data table
The following table provides the detailed values for students by academic year. Column headings identify the measure and reporting period; use the table to confirm exact values shown in the accompanying chart or summary.
| Academic year | Total students | FT students | FT % | PT students | PT % |
|---|---|---|---|---|---|
| 2024–2025 | 15,799 | 1,901 | 12.0% | 13,898 | 88.0% |
| 2025–2026 | 18,102 | 1,484 | 8.2% | 16,618 | 91.8% |
| 2026–2027* | 7,185 | 1,330 | 18.5% | 5,855 | 81.5% |
The term table separates K–5 and grades 6–12 enrollments for each reporting term. Term figures should not be added together to estimate unique students across the year.
View grade-group enrollment data table
The following table provides the detailed values for 2026–2027 term enrollments. Column headings identify the measure and reporting period; use the table to confirm exact values shown in the accompanying chart or summary.
| Term | K–5 | Grades 6–12 | Total |
|---|---|---|---|
| Fall 2026–2027* | 276 | 14,968 | 15,244 |
| Spring 2026–2027* | 248 | 12,368 | 12,616 |
| Summer 2027* | 0 | 0 | 0 |
Waitlist
Waitlist figures show student demand that could not immediately be accommodated. Read the count alongside its reporting date, as availability can change during enrollment.
Students waitlisted across 132 divisions.
Division Participation
Division participation measures the reach of VVA K–12 instruction across Virginia public school divisions. The map and counts illustrate access through local partnerships, not the number of students enrolled in each division.
New divisions added as needed, on an ongoing basis.
Secondary Course Enrollments by Department
Course enrollment totals describe registrations across subject areas, including core academics and electives. These are course enrollments rather than counts of unique students; one student may take multiple courses.
Enrollment by Grade Level
Core Courses
Bars represent course enrollments; counts and reported percentages are listed for each department.
View accessible data table
The following table provides the detailed values for core course enrollments by department. Column headings identify the measure and reporting period; use the table to confirm exact values shown in the accompanying chart or summary.
| Department | Enrollments | Reported share |
|---|---|---|
| English | 2,319 | 10.8% |
| History and Social Sciences | 3,504 | 16.4% |
| Mathematics | 2,448 | 11.5% |
| Science | 2,789 | 13.0% |
Elective Courses
Bars represent course enrollments; counts and reported percentages are listed for each department.
View accessible data table
The following table provides the detailed values for elective course enrollments by department. Column headings identify the measure and reporting period; use the table to confirm exact values shown in the accompanying chart or summary.
| Department | Enrollments | Reported share |
|---|---|---|
| Career and Technical Education | 1,352 | 6.3% |
| Computer Science | 712 | 3.3% |
| Fine Arts | 644 | 3.0% |
| Health and Physical Education | 1,068 | 5.0% |
| World Languages | 5,987 | 28.0% |
Virtual Virginia AP
Advanced Placement offerings provide opportunities for college-level coursework. The charts and tables below summarize participation and performance; review each measure’s label and reporting period before comparing results.
AP performance highlight
AP Student Performance
64% of Virtual Virginia students scored above the corresponding Virginia or global AP average.
This compares student AP scores with state or global benchmarks.
Average AP scores
View AP average score data table
The following table provides the detailed values for average ap exam scores, 2023–2026. Column headings identify the measure and reporting period; use the table to confirm exact values shown in the accompanying chart or summary.
| Group | Mean AP score (out of 5) |
|---|---|
| VVA | 3.23 |
| Virginia | 3.21 |
| Global | 3.20 |
Division Partnerships
Virtual Virginia works with local school divisions to expand instructional options, address scheduling challenges, and complement courses offered locally. The measures below describe the breadth of those partnerships.
Division partnership reach
of Virginia public school divisions relied on Virtual Virginia to deliver online instruction in 2025–2026.
Statewide partnership map
Dual Enrollment
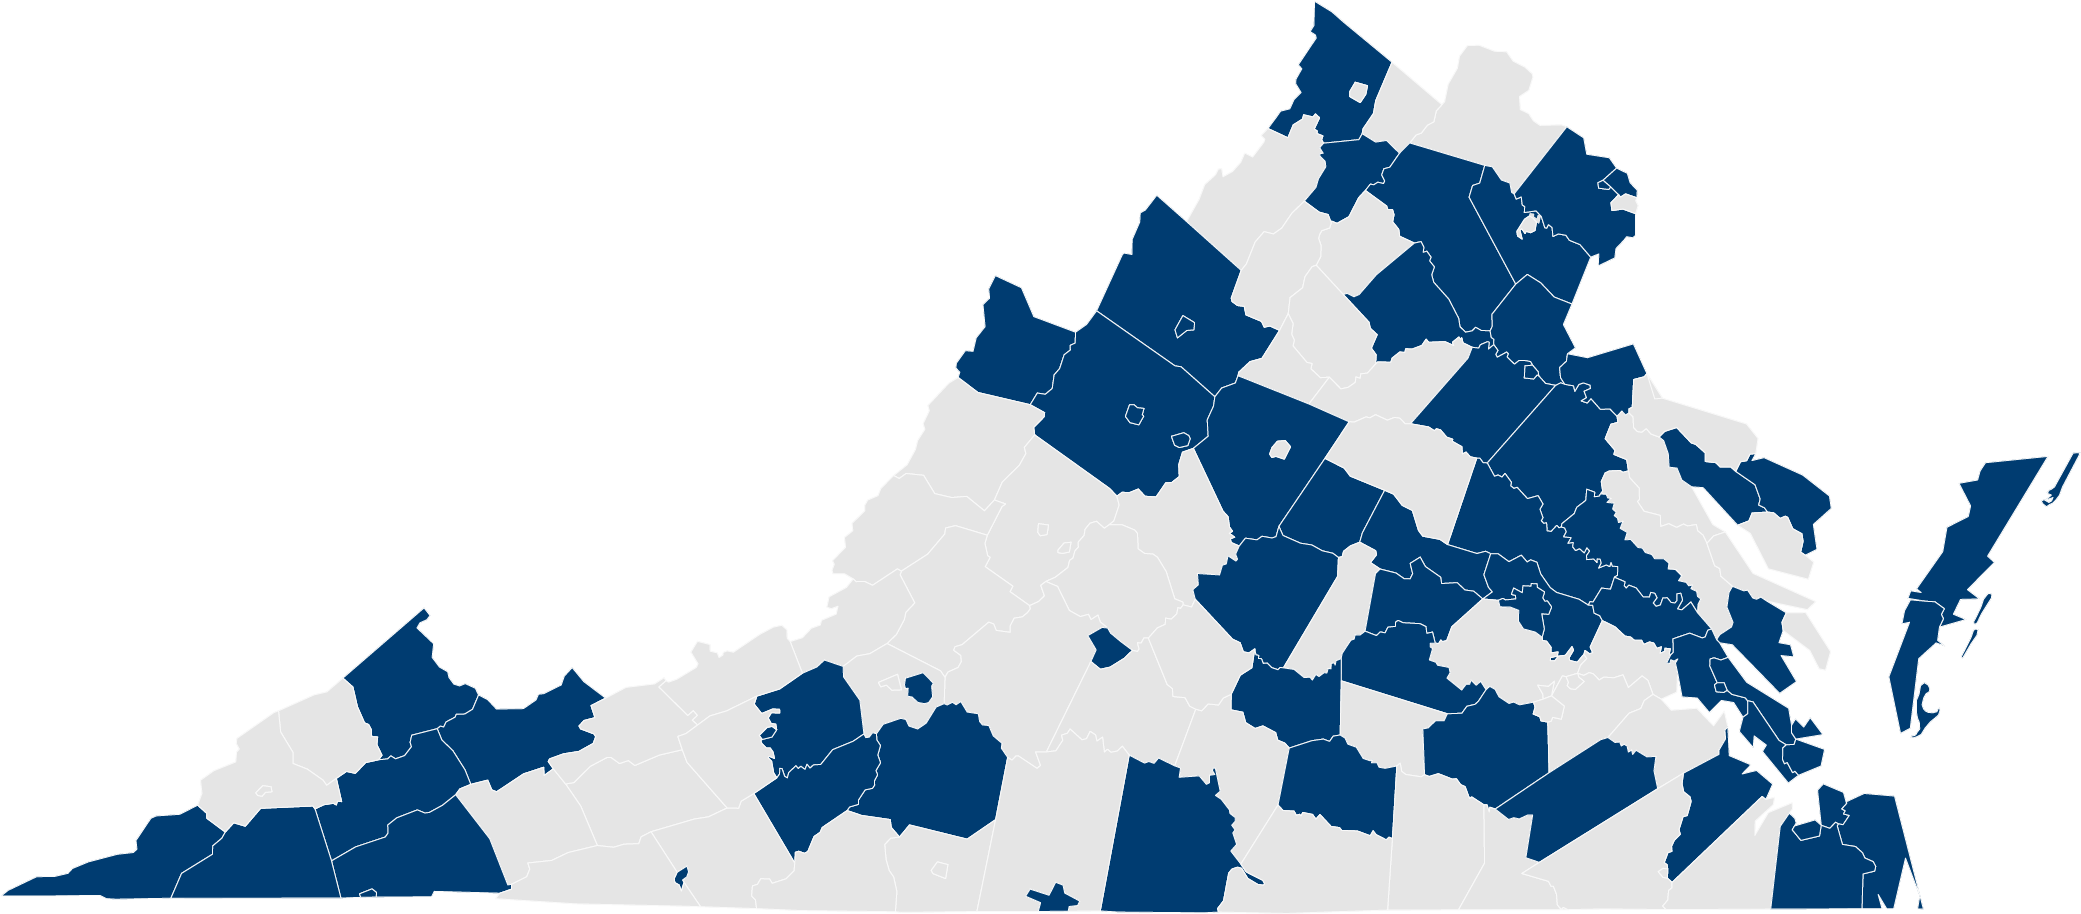
Dual enrollment courses allow eligible students to pursue college credit while completing high school coursework. The participation figures and division map describe the reach of these opportunities; the map is not a measure of student enrollment by division.
Dual enrollment participation
Virginia school divisions participated in VVA dual enrollment between 2022 and 2026.
Participating divisions map
Survey Feedback
Feedback from students, families, and school or division personnel helps VVA evaluate course access, instructional support, and the online learning experience. Percentages below represent survey responses, not the full enrolled population.
Students felt prepared for the responsibility and self-direction required for online courses.
Students reported having the necessary reading skills for the course.
Families were able to find and enroll in all the courses they wanted.
Students felt comfortable using online tools and software.
Staffing & Professional Development
Staffing, Credentials & Professional Development
Virginia-licensed educators support VVA’s K–12 courses through live instruction, individualized support, and ongoing professional learning. The measures below describe staffing, onboarding, credentials, and professional development for the dashboard’s reporting period; they are distinct from the annual-report totals for 2025–2026.
Licensure and Endorsements
Credential Status
96% fully licensed/endorsed
4% active endorsement verifications pending
September onboarding: 1 full-time and 21 part-time instructors.
View professional development topics
- Using AI in Learning — course and guided discussion
- Program Data Overview
- Instructional Approaches and Procedures aligned to NSQ for Online Teaching
- Literacy Direct Instruction
- Grades 4–8
- Student Support
- Stakeholder Panel
- Peer Observation
Summer Session
Summer Session Enrollment
VVA Summer Session extends online learning to students in grades 6–12, including students in public schools, private schools, and homeschools. Flexible summer cohorts support initial credit, accelerated coursework, dual enrollment, and credit recovery. The following chart and table compare participation by summer; the year-over-year measure compares consecutive sessions.
Virtual Virginia provides summer learning opportunities for students in grades K–12. The chart shows verified total enrollments for the three most recent summer sessions.
Enrollment by Summer
Year-over-Year Growth
88.4% growth from 2024 to 2026 (5,657 additional enrollments).
Summer enrollment increased each year, reaching 12,056 in 2026.
Summer 2026 included 12,056 grades 6–12 enrollments and 0 K–5 enrollments.
View detailed data table
The following table provides the detailed values for summer session enrollments by year. Column headings identify the measure and reporting period; use the table to confirm exact values shown in the accompanying chart or summary.
| Summer | Total enrollments | K–5 | Grades 6–12 |
|---|---|---|---|
| 2024 | 6,399 | Not reported | Not reported |
| 2025 | 8,540 | Not reported | Not reported |
| 2026 | 12,056 | 0 | 12,056 |
Professional Learning
Professional Learning Participation
Virtual Virginia provides synchronous and asynchronous professional learning at no cost to Virginia public school divisions. Educators can participate in webinars, courses, workshops, and other learning opportunities. The measures below describe program enrollments and popular offerings; enrollments should not be interpreted as unique educator counts.
Professional Learning Enrollments
Bar heights represent enrollments from a zero baseline. *2026–2027 is year-to-date through October 9, 2026; other figures represent full academic years.
2026–2027
Current Year Snapshot
Professional learning enrollments recorded July 1–October 9, 2026.
View professional learning enrollment data
The following table provides the detailed values for professional learning enrollment counts by reporting period. Column headings identify the measure and reporting period; use the table to confirm exact values shown in the accompanying chart or summary.
| Academic year | Enrollments | Reporting period | Status |
|---|---|---|---|
| 2023–2024 | 6,120 | July 1, 2023 – June 30, 2024 | Reported |
| 2024–2025 | 11,350 | July 1, 2024 – June 30, 2025 | Reported |
| 2025–2026 | 14,035 | July 1, 2025 – June 30, 2026 | Reported |
| 2026–2027* | 9,213 | July 1 – October 9, 2026 | Partial year |
Top 10 Professional Learning Courses by Enrollment
Courses and resources are presented in the supplied ranking order. Individual course enrollment counts were not provided.
View top 10 courses
The following table provides the detailed values for top ten professional learning courses by enrollment. Column headings identify the measure and reporting period; use the table to confirm exact values shown in the accompanying chart or summary.
| Rank | Course or resource |
|---|---|
| 1 | VVA Statewide Professional Learning Meeting |
| 2 | VVA School Support & Partnership Meeting |
| 3 | 2026 VITAL Conference |
| 4 | ITRT (Resource Hub) |
| 5 | Statewide AI Professional Learning Train-the-Trainer |
| 6 | VVA Outreach Program Hub |
| 7 | Governor’s Schools Virtual Summit |
| 8 | The VVA Guide to GenAI: Using Gemini and NotebookLM |
| 9 | WIDA for School and Division Leaders |
| 10 | Math Professional Development Resources |
Statewide LMS
Statewide Learning Management System
Virginia’s Statewide LMS supports digital instruction and professional learning through independently administered Canvas instances for public school divisions and participating organizations. VVA Outreach complements this access with standards-aligned instructional resources, training, and support. The figures below distinguish statewide availability from resource downloads and use.
Virginia’s Statewide Learning Management System supports online instruction and professional learning across public school divisions and other participating educational organizations. Each public school division maintains its own independent Canvas LMS instance. Through VVA Outreach, educators can also access standards-aligned digital instructional resources, training, and support at no cost to divisions.
Through the VVA Outreach Program, Virginia public schools have access to Canvas and free digital learning resources, along with training and support.
Statewide Availability
Access does not necessarily mean active adoption or use.
Resources and Support
Divisions can use VVA Outreach Resources and create customized instructional content. VVA provides training and ongoing support through the Outreach Program Hub.
Resources are aligned with Virginia Standards of Learning.
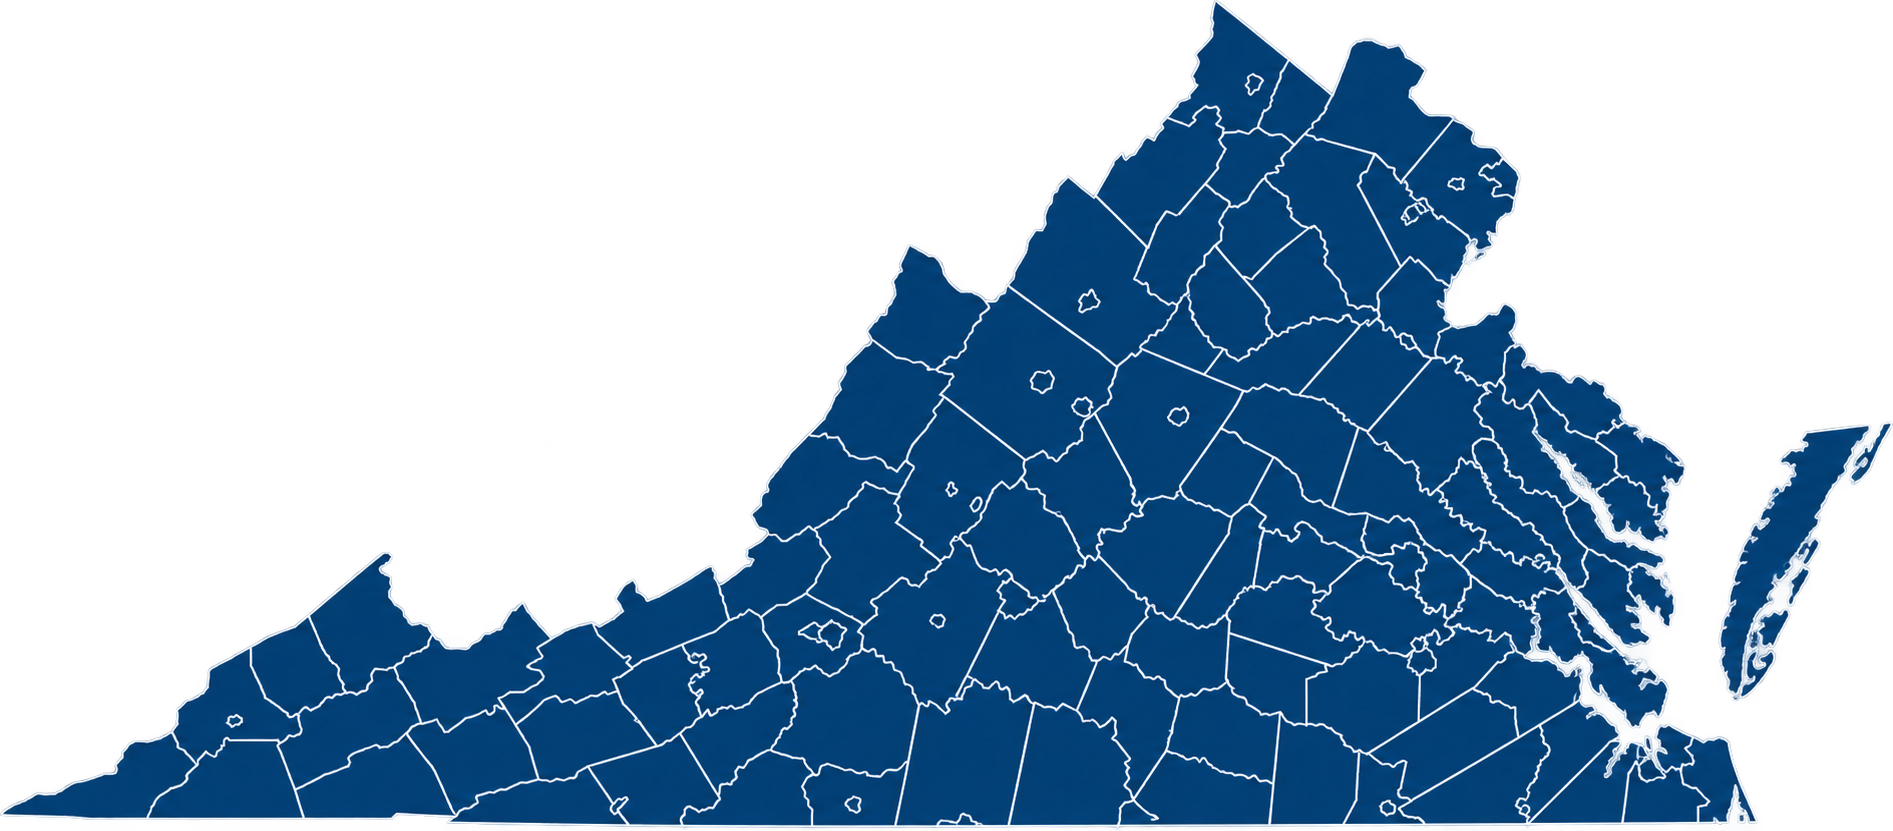
Statewide LMS Coverage
All Virginia public school divisions maintain independent Statewide LMS instances, according to the 2026 annual report. Availability does not indicate how frequently each division uses the system.
Technology & User Support
Monthly Technology Performance
Reliable digital tools help educators and learners access instruction. These monthly performance measures show how the monitored website or service performed over the stated periods; desktop and mobile scores should be considered separately.
System reliability and incident measures for the reported month.
Monthly Help Desk & User Support
User support helps students, families, and educators resolve technical and program questions. The figures below summarize reported tickets, resolution rates, and the share of requests by category. Category percentages describe the distribution of requests, not their severity.
Ticket Resolution
9 tickets remain unresolved in the reported total.
761 of 770 tickets resolved (98.8%)
Support Categories
Ticket Distribution
Tech Support: 59.9%
Registration: 20.5%
Main Office: 15.3%
K–12 Instruction: 4.3%
Percentages describe ticket categories, not a user satisfaction rating.
View detailed data table
The following table provides the detailed values for help desk tickets by category. Column headings identify the measure and reporting period; use the table to confirm exact values shown in the accompanying chart or summary.
| Ticket category | Share |
|---|---|
| Tech Support | 59.9% |
| Registration | 20.5% |
| Main Office | 15.3% |
| K–12 Instruction | 4.3% |
Financial Overview
Program Financial Overview
The financial overview organizes reported program obligations by category. Use the figures and detailed table together to understand the distribution of costs for the stated reporting period; these measures should not be confused with student enrollment or program participation.
Budget Obligations by Category
Distribution of the $9,625,588.55 in listed category obligations across six categories as of September 29, 2026. Slice sizes represent obligated dollars, not each category’s percentage of its own budget.
Obligated expenditures
- Fiscal Agent Fee$386,000.004.0%
- VVA Admin$2,168,861.5522.5%
- Purchased Services$4,580,919.0047.6%
- Outreach Program$330,000.003.4%
- K–12 Admin$498,000.005.2%
- K–12 Faculty$1,661,808.0017.3%
Percentages are rounded to one decimal place. The supplied subtotal is $9,625,589.55, which is $1.00 higher than the sum of the six listed categories; verify the source data before publication. The detailed table below retains each category’s obligated percentage of its budget.
View complete program expenditures table
The following table provides the detailed values for program expenditures by budget line item. Column headings identify the measure and reporting period; use the table to confirm exact values shown in the accompanying chart or summary.
| Line item | Core operations | LMS / technical | Total budgeted | Obligated ($) | Obligated (%) |
|---|---|---|---|---|---|
| Fiscal Agent Fee | $386,000.00 | $0.00 | $386,000.00 | $386,000.00 | 100% |
| VVA Admin | $1,500,000.00 | $1,138,000.00 | $2,638,000.00 | $2,168,861.55 | 82% |
| Purchased Services | $800,000.00 | $4,000,000.00 | $4,800,000.00 | $4,580,919.00 | 95% |
| Outreach Program | $330,000.00 | $0.00 | $330,000.00 | $330,000.00 | 100% |
| K–12 Admin | $498,000.00 | $0.00 | $498,000.00 | $498,000.00 | 100% |
| K–12 Faculty | $1,661,808.00 | $0.00 | $1,661,808.00 | $1,661,808.00 | 100% |
| Subtotals | $5,175,808.00 | $5,138,000.00 | $10,313,808.00 | $9,625,589.55 | 93% |
Relevant Citations
Virtual Virginia Program Plan (Last updated – March 2022) – maintains 6,000 free annual statewide enrollments, page 3.
2026 Virtual Virginia Board of Education Annual Report (submitted for board review 8/25/26).