

Statewide reach · Educational impact
By the Numbers
Explore Virtual Virginia’s enrollment, partnerships, student achievement, and professional learning across the Commonwealth.
Virtual Virginia partners with Virginia public school divisions to expand online learning opportunities for students and educators.
Reporting periods are noted with each section.
Data
Click or tap each category below to view recent VVA-related data.
K–12 Instruction
Enrollment
Virtual Virginia provides full-time and part-time K–12 instruction through Virginia-licensed teachers, including courses aligned with Virginia’s Standards of Learning (SOL).
The 2026–2027 enrollment figures are as of October 30, 2026; earlier academic years are shown for comparison.
Full-time vs. part-time students
Full-time and part-time enrollment by academic year.
Enrollments by grade group and term
Course enrollments by term and grade group.
View full-time and part-time student data table
| Academic year | Total students | FT students | FT % | PT students | PT % |
|---|---|---|---|---|---|
| 2024–2025 | 15,799 | 1,901 | 12.0% | 13,898 | 88.0% |
| 2025–2026 | 18,102 | 1,484 | 8.2% | 16,618 | 91.8% |
| 2026–2027* | 7,185 | 1,330 | 18.5% | 5,855 | 81.5% |
View grade-group enrollment data table
| Term | K–5 | Grades 6–12 | Total |
|---|---|---|---|
| Fall 2026–2027* | 276 | 14,968 | 15,244 |
| Spring 2026–2027* | 248 | 12,368 | 12,616 |
| Summer 2027* | 0 | 0 | 0 |
Waitlist
Students waitlisted across 132 divisions.
Division Participation
Secondary Course Enrollments by Department
VVA offers core academic courses, electives, and career-focused subjects for K–12 learners.
Enrollment by Grade Level
Core Courses
View accessible data table
| Department | Enrollments | Reported share |
|---|---|---|
| English | 2,319 | 10.8% |
| History and Social Sciences | 3,504 | 16.4% |
| Mathematics | 2,448 | 11.5% |
| Science | 2,789 | 13.0% |
Elective Courses
View accessible data table
| Department | Enrollments | Reported share |
|---|---|---|
| Career and Technical Education | 1,352 | 6.3% |
| Computer Science | 712 | 3.3% |
| Fine Arts | 644 | 3.0% |
| Health and Physical Education | 1,068 | 5.0% |
| World Languages | 5,987 | 28.0% |
Virtual Virginia Advanced Placement
VVA Advanced Placement courses offer college-level instruction and opportunities to earn college credit.
AP performance highlight
AP Student Performance
64% of Virtual Virginia students scored above the corresponding Virginia or global AP average.
Average AP scores
View AP average score data table
| Group | Mean AP score (out of 5) |
|---|---|
| VVA | 3.23 |
| Virginia | 3.21 |
| Global | 3.20 |
Division Partnerships
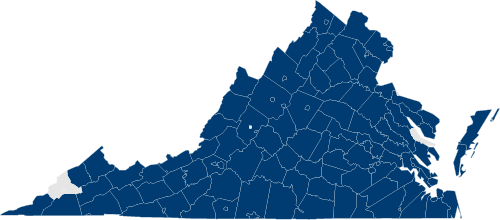
Virtual Virginia works with public school divisions to expand access to online courses statewide.
Division partnership reach
of Virginia public school divisions participated in the VVA K–12 Instruction Program from 2023 through 2026.
Statewide partnership map
Dual Enrollment
VVA dual enrollment pathways allow high school students to earn college credit or pursue a cybersecurity credential.
Dual enrollment participation
Current dual enrollment course enrollmentsAs of October 30, 20261.23% of total program enrollments
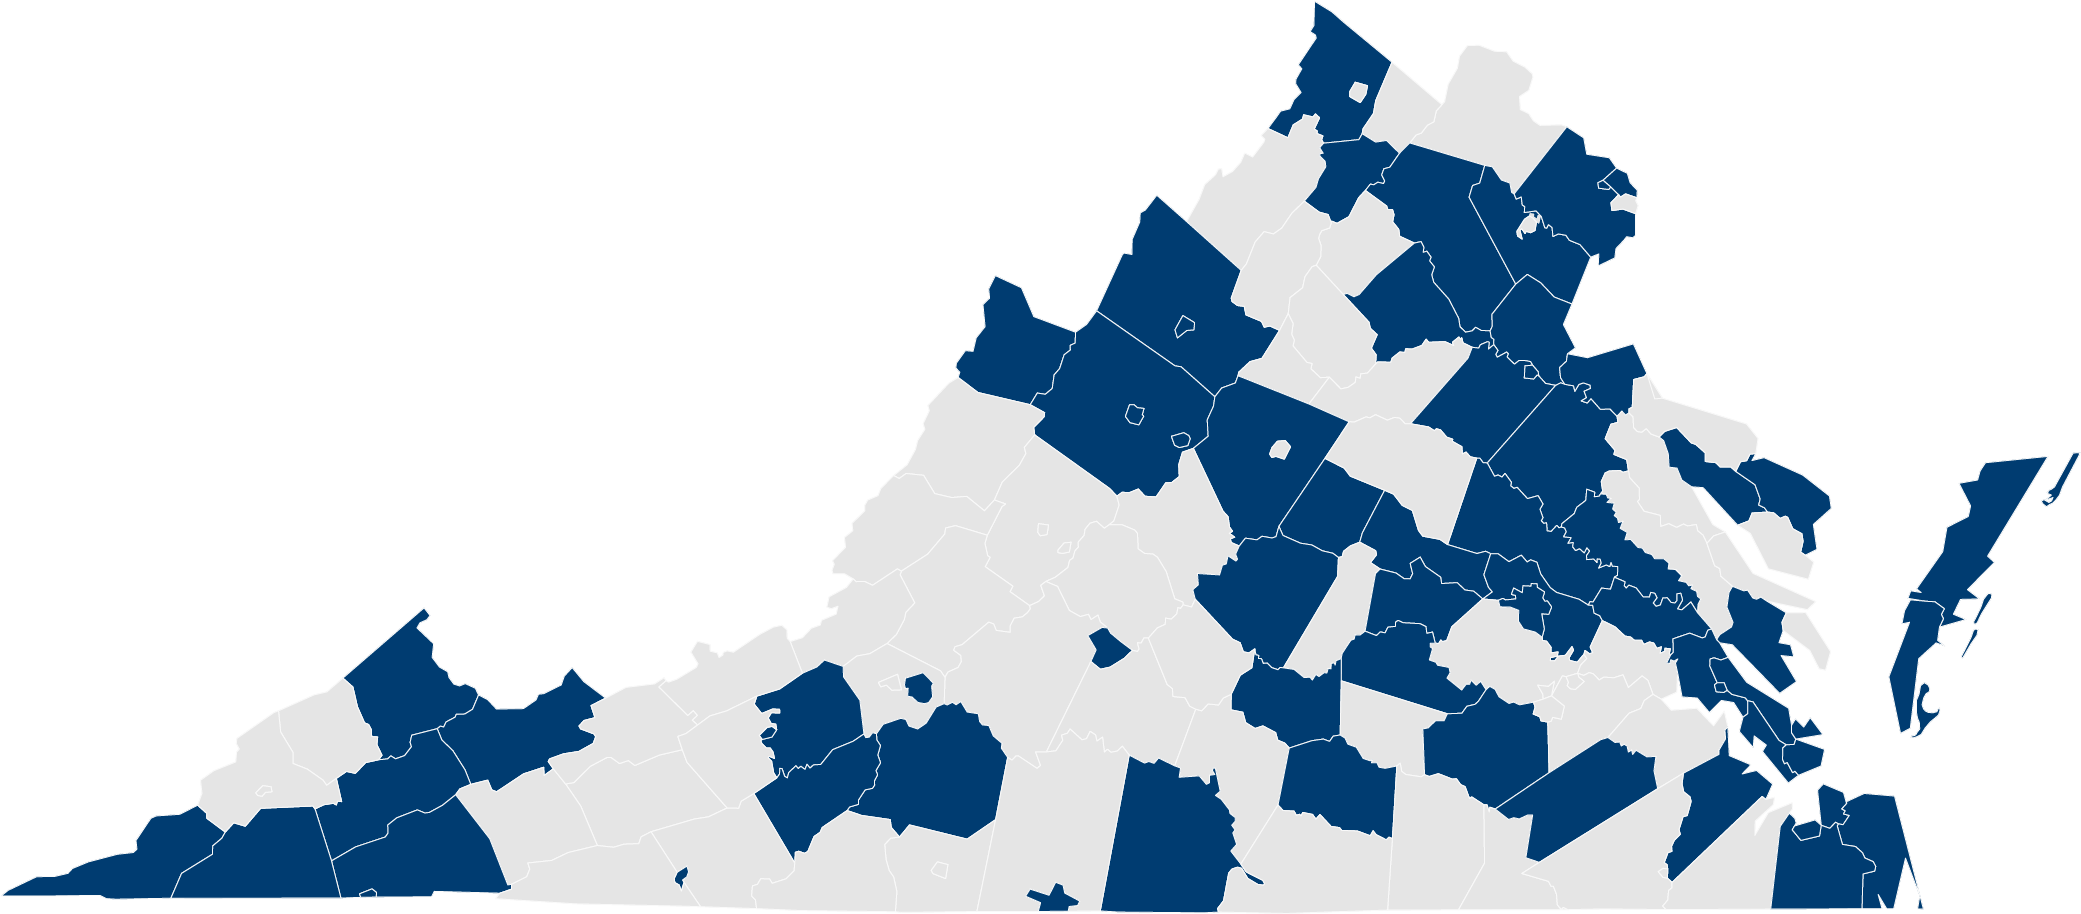
Virginia school divisions participated in VVA dual enrollment between 2022 and 2026.
Participating divisions map
Survey Feedback
Students and families share feedback about their VVA learning experience.
Students felt prepared for the responsibility and self-direction required for online courses.
Students reported having the necessary reading skills for the course.
Families were able to find and enroll in all the courses they wanted.
Students felt comfortable using online tools and software.
Students could enroll in all the courses they wanted.
Staffing & Professional Development
Staffing, Credentials & Professional Development
Virginia-certified instructors teach VVA courses and participate in ongoing professional development.
Licensure and Endorsements
Credential Status
96% fully licensed/endorsed
4% active endorsement verifications pending
September onboarding: 1 full-time and 21 part-time instructors.
View professional development topics
- Using AI in Learning — course and guided discussion
- Program Data Overview
- Instructional Approaches and Procedures aligned to NSQ for Online Teaching (2025)
- Literacy Direct Instruction in Grades 4–8
- Student Supports and Accessibility
- School Leadership Perspectives Panel
- Peer Synchronous Session Observation
Summer Session
Summer Session Enrollment
VVA Summer Session offers virtual courses and credit recovery for students in grades 6–12.
Enrollment by Summer
Year-over-Year Growth
88.4% growth from 2024 to 2026 (5,657 additional enrollments).
Summer enrollment increased each year, reaching 12,056 in 2026.
View detailed data table
| Summer | Grades 6–12 enrollments |
|---|---|
| 2024 | 6,399 |
| 2025 | 8,540 |
| 2026 | 12,056 |
Professional Learning
Professional Learning Participation
VVA offers free online professional learning for Virginia public school educators, including courses, webinars, meetings, and workshops.
Professional Learning Enrollments
*2026–2027 through November 9, 2026.
2026–2027
Current Year Snapshot
Professional learning enrollments recorded July 1–November 9, 2026.
View professional learning enrollment data
| Academic year | Enrollments | Reporting period | Status |
|---|---|---|---|
| 2024–2025 | 11,350 | July 1, 2024 – June 30, 2025 | Reported |
| 2025–2026 | 14,035 | July 1, 2025 – June 30, 2026 | Reported |
| 2026–2027* | 10,173 | July 1 – November 9, 2026 | Partial year |
Top 10 Professional Learning Courses and Events
Top professional learning courses and meetings ranked by participation.
View top 10 courses and events
| Rank | Course or event | Enrollments / participants |
|---|---|---|
| 1 | VDOE Human Trafficking | 4,790 |
| 2 | VVA Statewide Professional Learning Meeting | 840 |
| 3 | Number and Number Sense in Grades 4–8 | 637 |
| 4 | Elevating the Mathematics Process Goals to Increase Student Outcomes in Grades 4–8 | 630 |
| 5 | Virginia School Librarian (Resource Hub) | 558 |
| 6 | Patterns, Functions, and Algebra in Grades 4–8 | 510 |
| 7 | At-Risk Afterschool Meals Program Meal Service Requirements 2026–27 | 233 |
| 8 | At-Risk Afterschool Meals Program Administrative Requirements 2026–27 | 224 |
| 9 | VVA School Support & Partnership Meeting | 180 |
| 10 | The Quill: VDOE History and Social Science Hub (Resource Hub) | 143 |
Statewide LMS
Statewide Learning Management System
Virginia’s Statewide Learning Management System (LMS), currently Canvas, supports virtual instruction and professional learning for Virginia public school divisions. The VVA Outreach Program provides free digital instructional resources, training, and support.
Statewide Availability
Resources and Support
The VVA Outreach Program provides standards-aligned instructional resources and professional learning for Virginia educators.
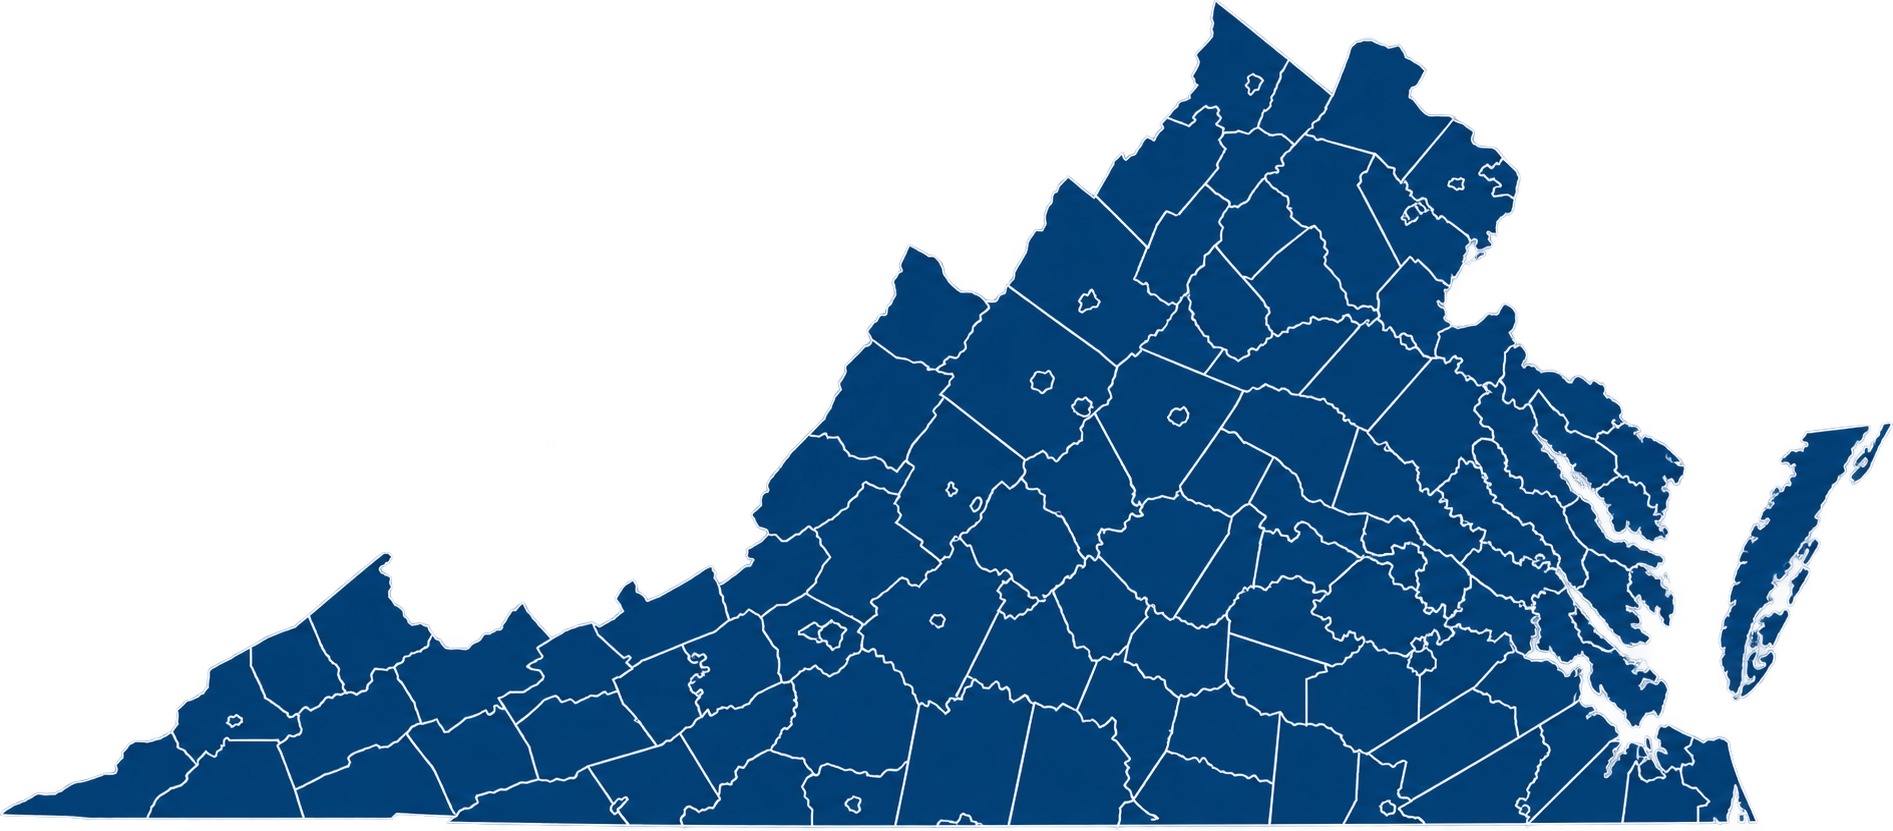
Statewide LMS Coverage
Statewide LMS access is available to all Virginia public school divisions.
Technology & User Support
Monthly Technology Performance
VVA monitors system reliability to support uninterrupted online learning.
Monthly Help Desk & User Support
VVA Support assists students, families, and educators with accounts, enrollment, and technology.
Ticket Resolution
9 tickets remain unresolved in the reported total.
761 of 770 tickets resolved (98.8%)
Support Categories
Ticket Distribution
Tech Support: 59.9%
Registration: 20.5%
Main Office: 15.3%
K–12 Instruction: 4.3%
View detailed data table
| Ticket category | Share |
|---|---|
| Tech Support | 59.9% |
| Registration | 20.5% |
| Main Office | 15.3% |
| K–12 Instruction | 4.3% |
Financial Overview
Program Financial Overview
This section summarizes VVA program funding and budget obligations.
Budget Obligations by Category
Obligated expenditures by budget category.
Obligated expenditures
- Fiscal Agent Fee$386,000.004.0%
- VVA Admin$2,168,861.5522.5%
- Purchased Services$4,580,919.0047.6%
- Outreach Program$330,000.003.4%
- K–12 Admin$498,000.005.2%
- K–12 Faculty$1,661,808.0017.3%
View complete program expenditures table
| Line item | Core operations | LMS / technical | Total budgeted | Obligated ($) | Obligated (%) |
|---|---|---|---|---|---|
| Fiscal Agent Fee | $386,000.00 | $0.00 | $386,000.00 | $386,000.00 | 100% |
| VVA Admin | $1,500,000.00 | $1,138,000.00 | $2,638,000.00 | $2,168,861.55 | 82% |
| Purchased Services | $800,000.00 | $4,000,000.00 | $4,800,000.00 | $4,580,919.00 | 95% |
| Outreach Program | $330,000.00 | $0.00 | $330,000.00 | $330,000.00 | 100% |
| K–12 Admin | $498,000.00 | $0.00 | $498,000.00 | $498,000.00 | 100% |
| K–12 Faculty | $1,661,808.00 | $0.00 | $1,661,808.00 | $1,661,808.00 | 100% |
| Subtotals | $5,175,808.00 | $5,138,000.00 | $10,313,808.00 | $9,625,589.55 | 93% |